Forge
Data analytics is the backbone of Capital One. Using a combination of spreadsheet tables and formulas, decisions like how much credit to loan a customer or who to market a new housing loan to are determined. Overtime this system has become undocumented and slow – threatening what is originally an asset to become a burden. Forge is a new analytics tool developed in-house to modernize this process.
Intro
I was recruited to design the tool’s UI. Being the opportune designer I am, I quickly expanded my role to introduce design to my team and influence the product vision of the project. After researching users, I held a workshop with my tech and product partners that got buy-in for user needs and prioritized the vision of our product for our Minimum Viable Product (MVP) build. I worked closely with my team to design a multi-feature MVP that shipped to our analysts.
My Role
Setting strategy and vision
I created flow diagrams and personas through interviews and contextual inquiry studies with users. I worked closely with 2 user researchers in this process.
Unifying team roadmap
I facilitated a workshop that unified design, product and tech partners. This helped us prioritize features based on business expectations, user needs and tech feasibility.
UI/UX Execution
I designed the web UI and UX for the Forge analytics platform. Every week I worked with my product manager to prioritize sprint tasks. I implemented hand-in-hand with my developers through using Zeplin, making InVision prototypes and creating a design system. This work was released to analysts in an MVP build.
Team
8 People (Product Managers, Engineers, UX Researchers)
Research & Strategy: The problems of data analysts
To understand the problems of our data analysts in offices all over the country I worked with researchers to design a remote contextual inquiry. We video called our users so that they could share their computer screen as they did their day-to-day analytics work. We were able to see first-hand the massive and slow excel spreadsheets our analysts had to work with.
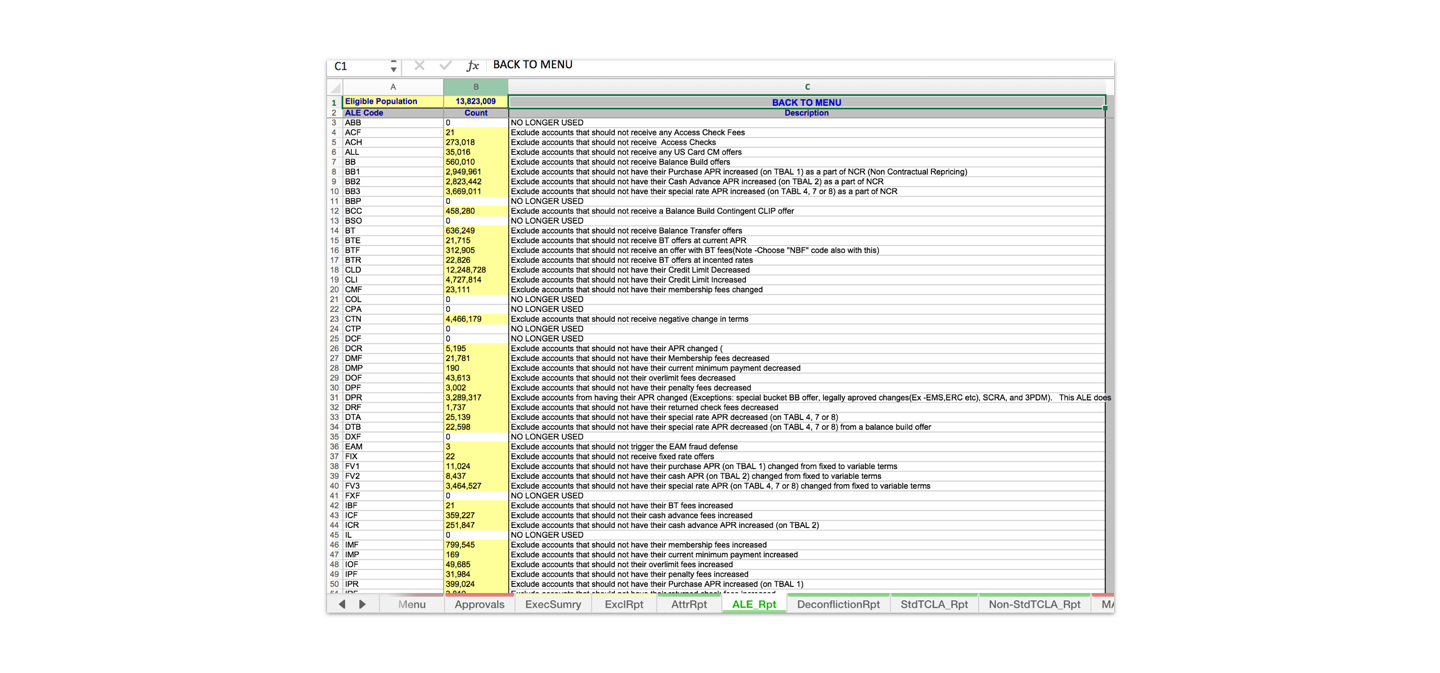
Talking with users we found that they didn’t actually understand the content of some of these tables, as they contained formulas and rules created by people that may not even be with the company anymore. One analyst even described this as “seeing the history of a company through a spreadsheet”.
Running analysis work would sometimes take hours to process – freezing programs so that any other work could not be done in parallel. This could happen even when running a small test process, as these table files had grown large and lumbering.
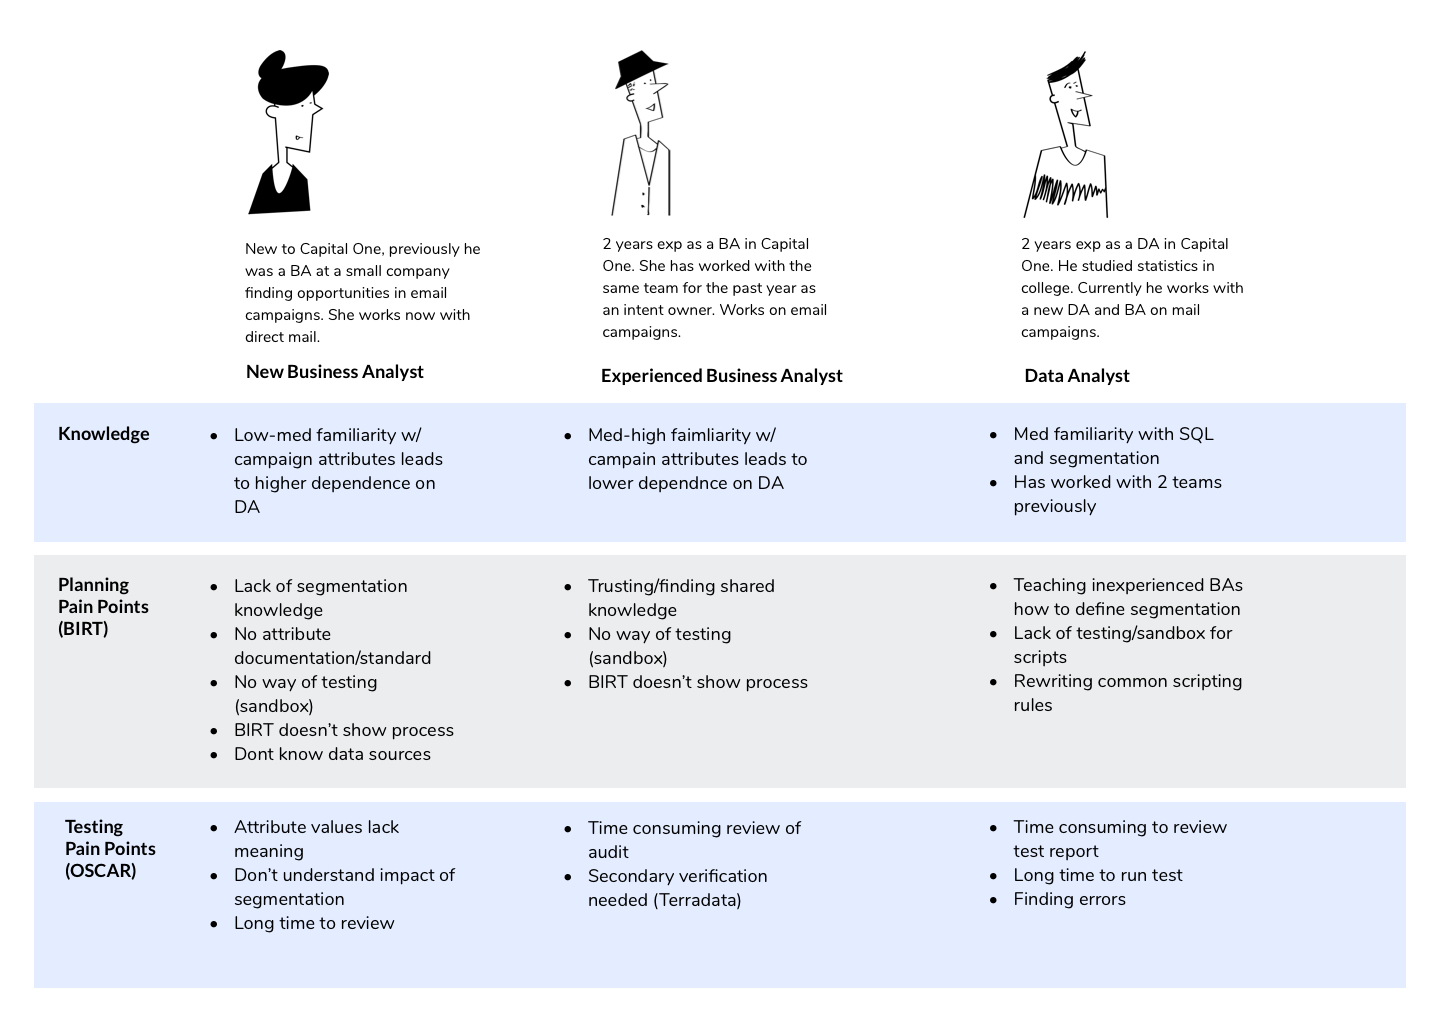
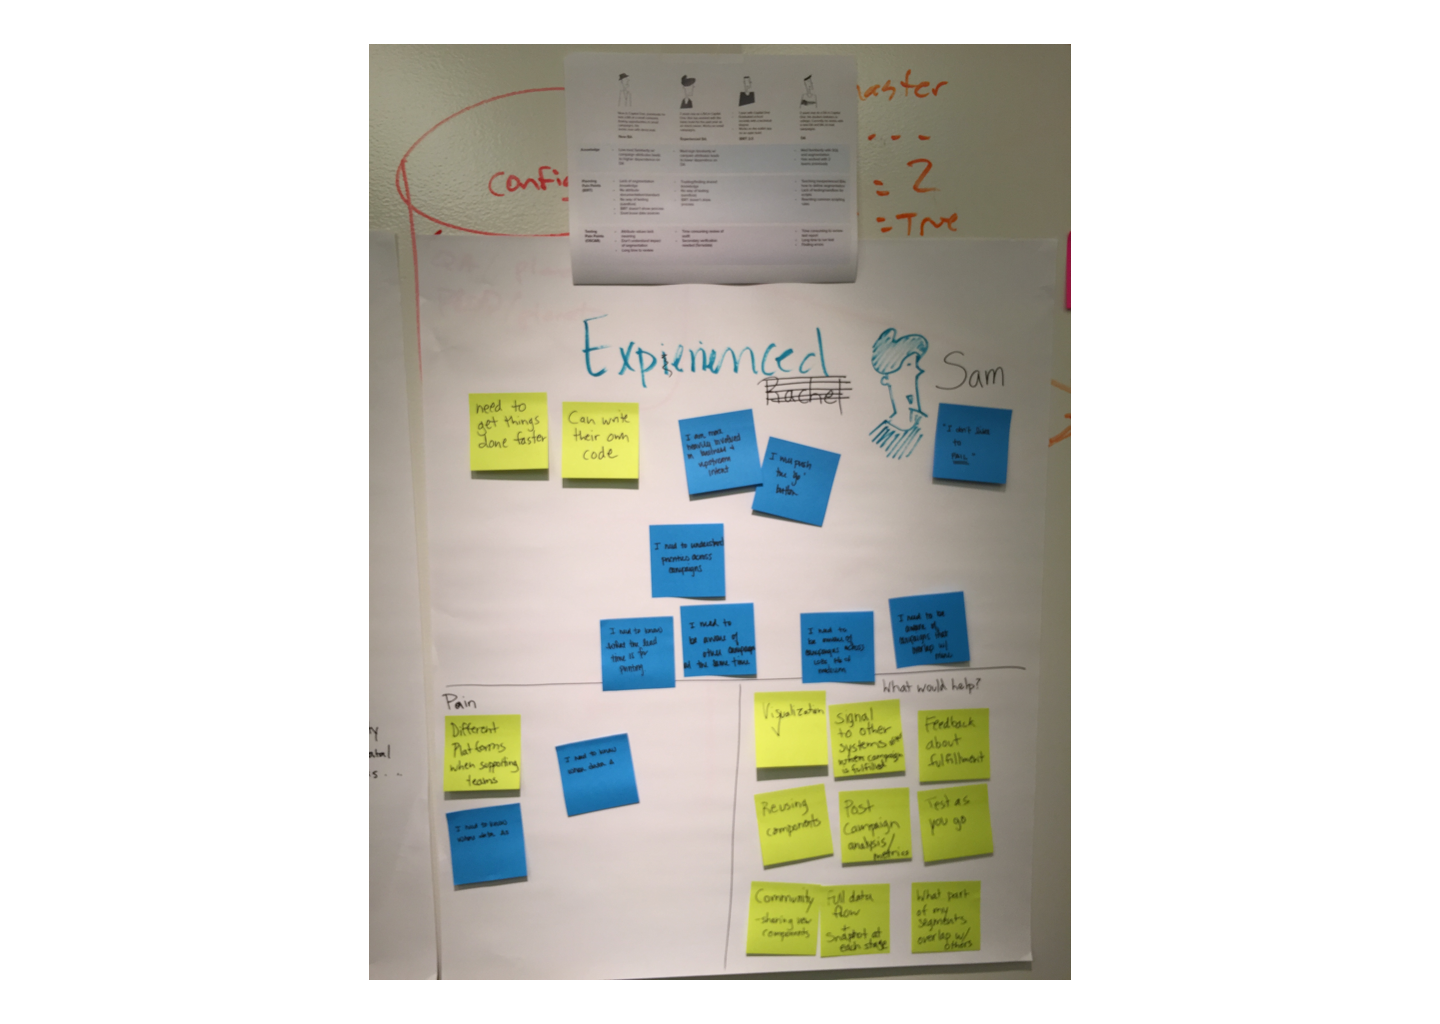
I created personas in order to segment the different types of analysts I had interviewed and show their specific problems.
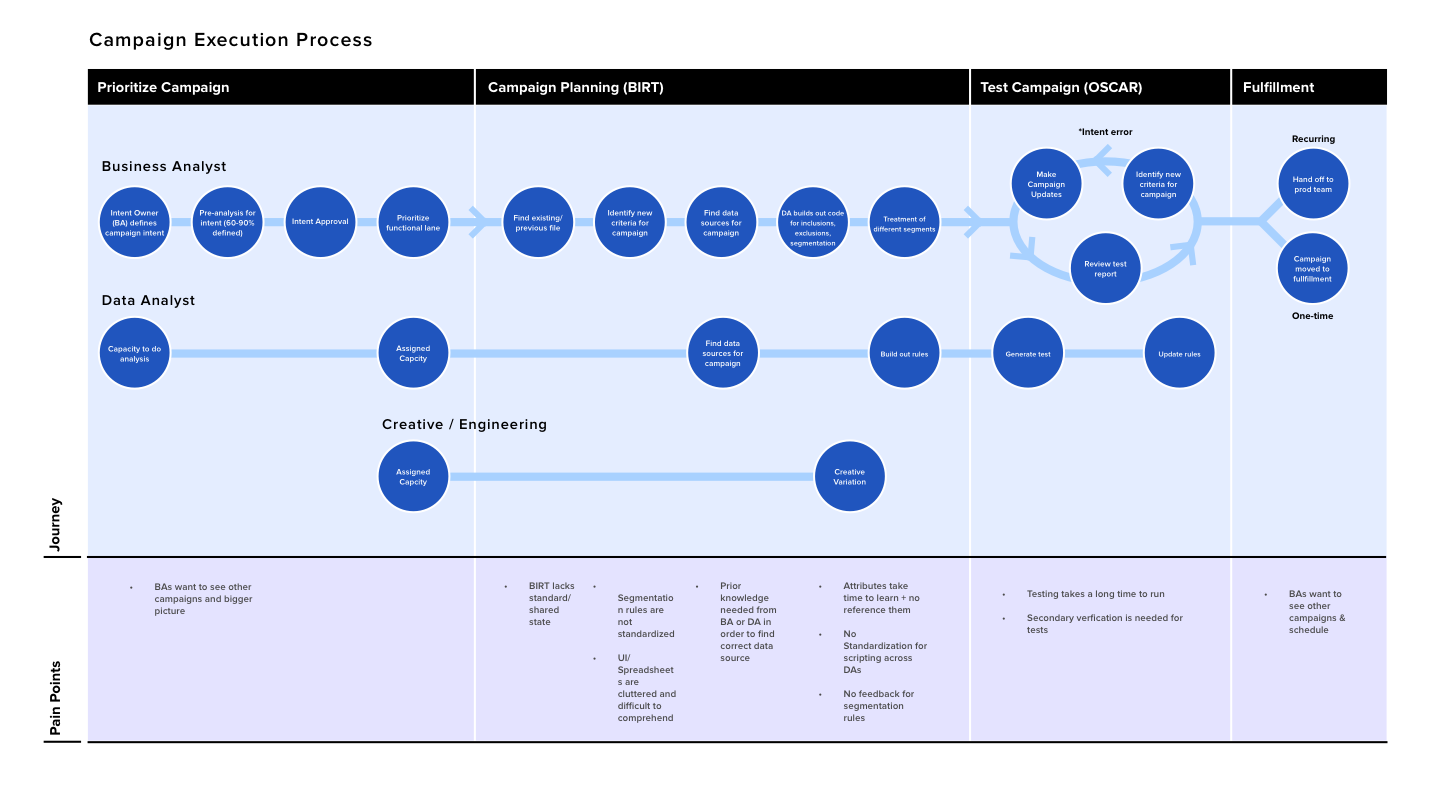
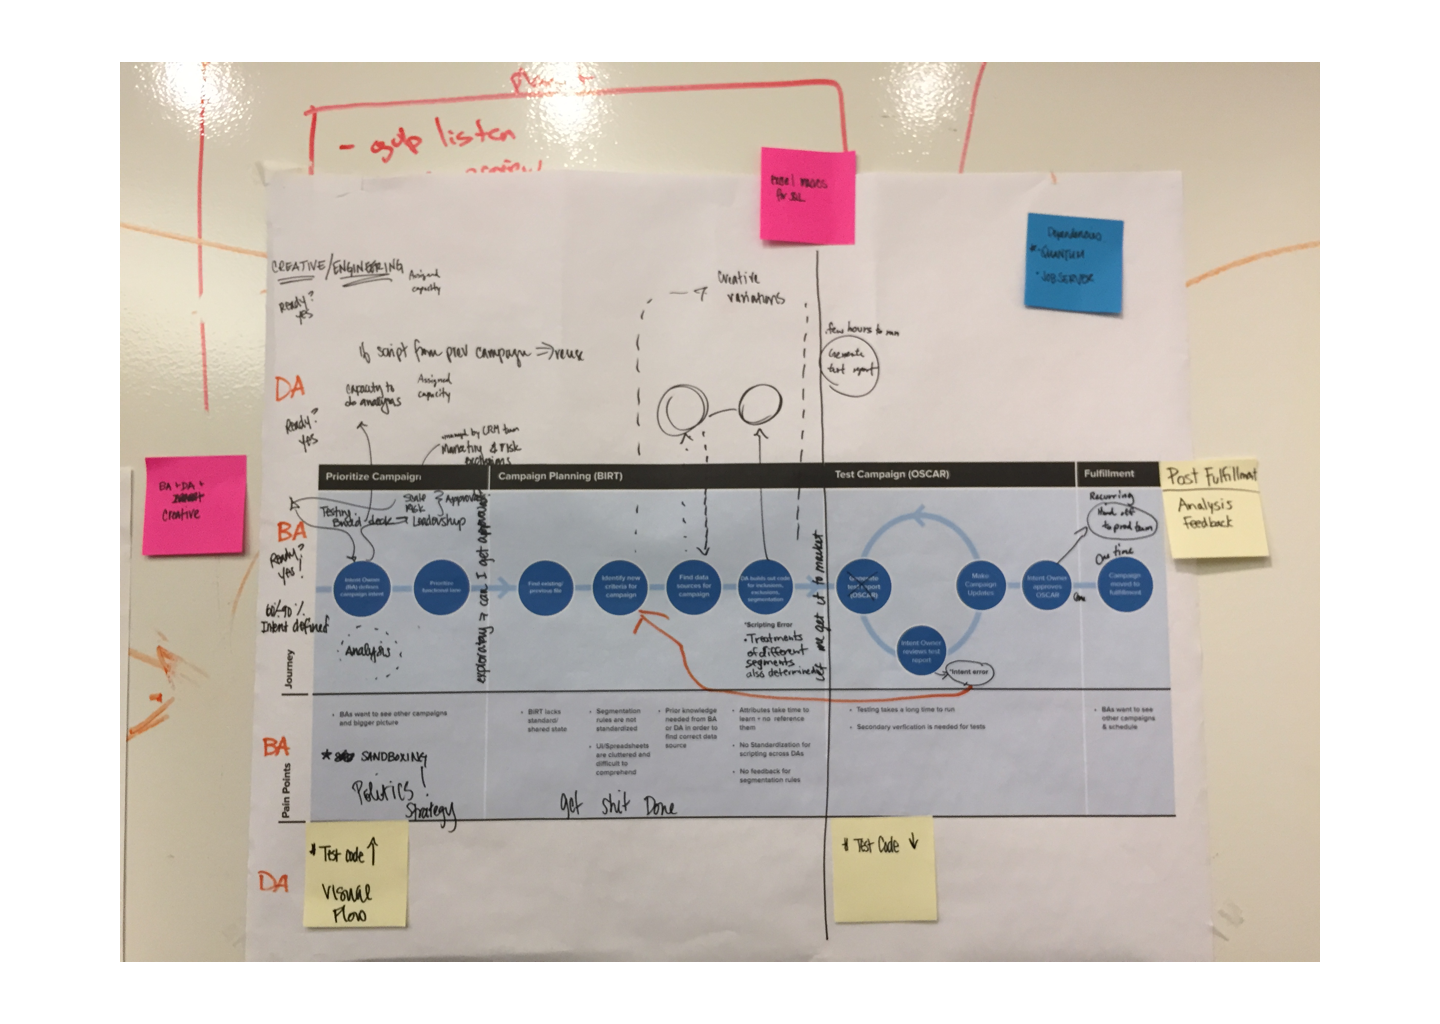
Along with this I created a process diagram to show how an analyst went about their work.
I held a workshop with my product and technical partners with the goal of setting the vision for our product’s MVP release. I used my design artifacts to have a co-creation session with my team to decide how to tackle the problems of our users.
Using these design artifacts as a guide, our team was able to focus on the Data Analyst persona as our main user. With this intention we then prioritized the persona’s problems into features that we would implement into our MVP build.
UI/UX: Designing the MVP Build
With our priorities set it was my job to design UX solutions with my team.
Problem 1: There is a lack of standardization among formulas and excel sheets
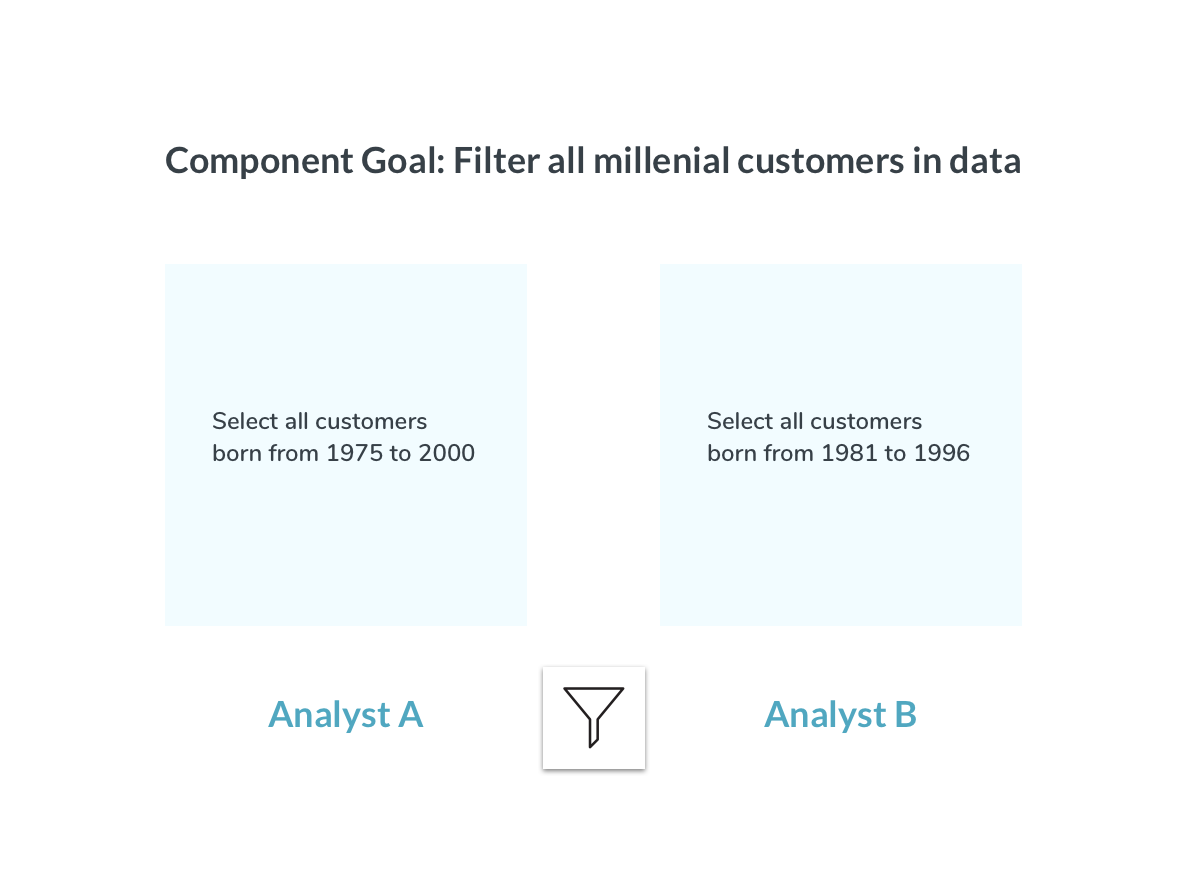
One problem that analysts pointed out was that work was often duplicated. For example, let’s say as part of their process analysts wanted to segment out a population of millennial customers. Each analyst was doing this same formula differently or had to reinvent it every time. In the example below, both analysts are using a different age range to filter out the ‘millennial’ population.
Imagine if you had a pizza restaurant and one cook already knew how to cook the best dough, wouldn’t you want all the other cooks to know how to make that dough as well? And if a new cook came, you would not want them to learn how to make dough from scratch. Likewise, I wanted new analysts to know the best way to do their job based off of what experienced analysts already had learned. That way, analysts could get finding new nuggets of data instead of getting spending time rewriting code that already existed.
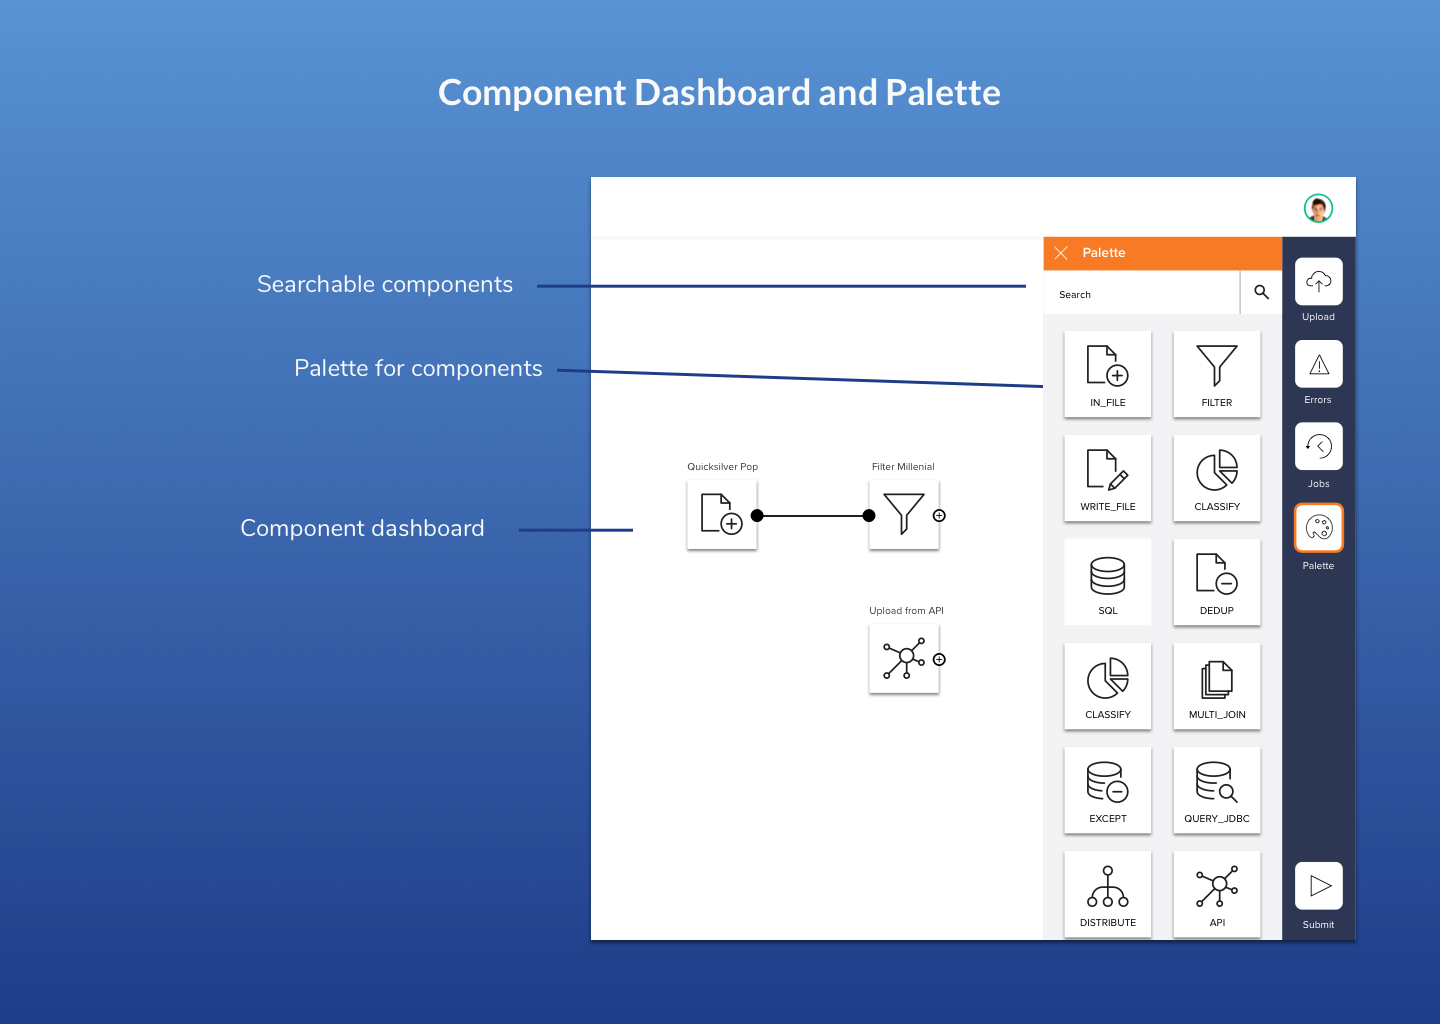
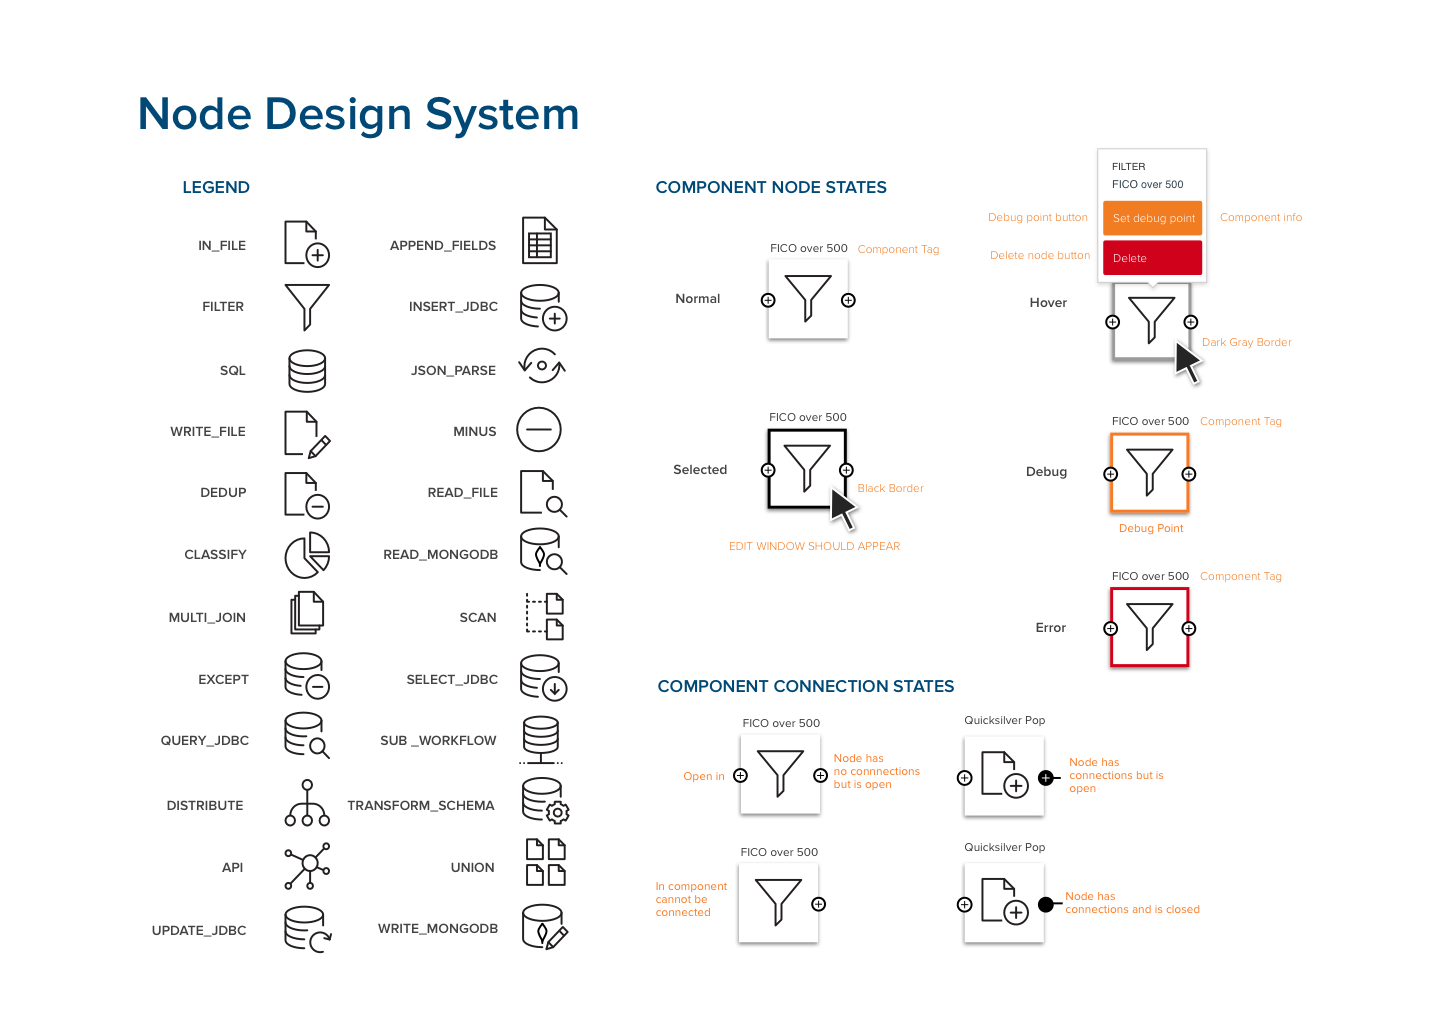
When showing potential solutions to users, we found that there were specific parts of the process that were most common to them. I decided to chunk these parts into different components of code that could be shared among other analysts.
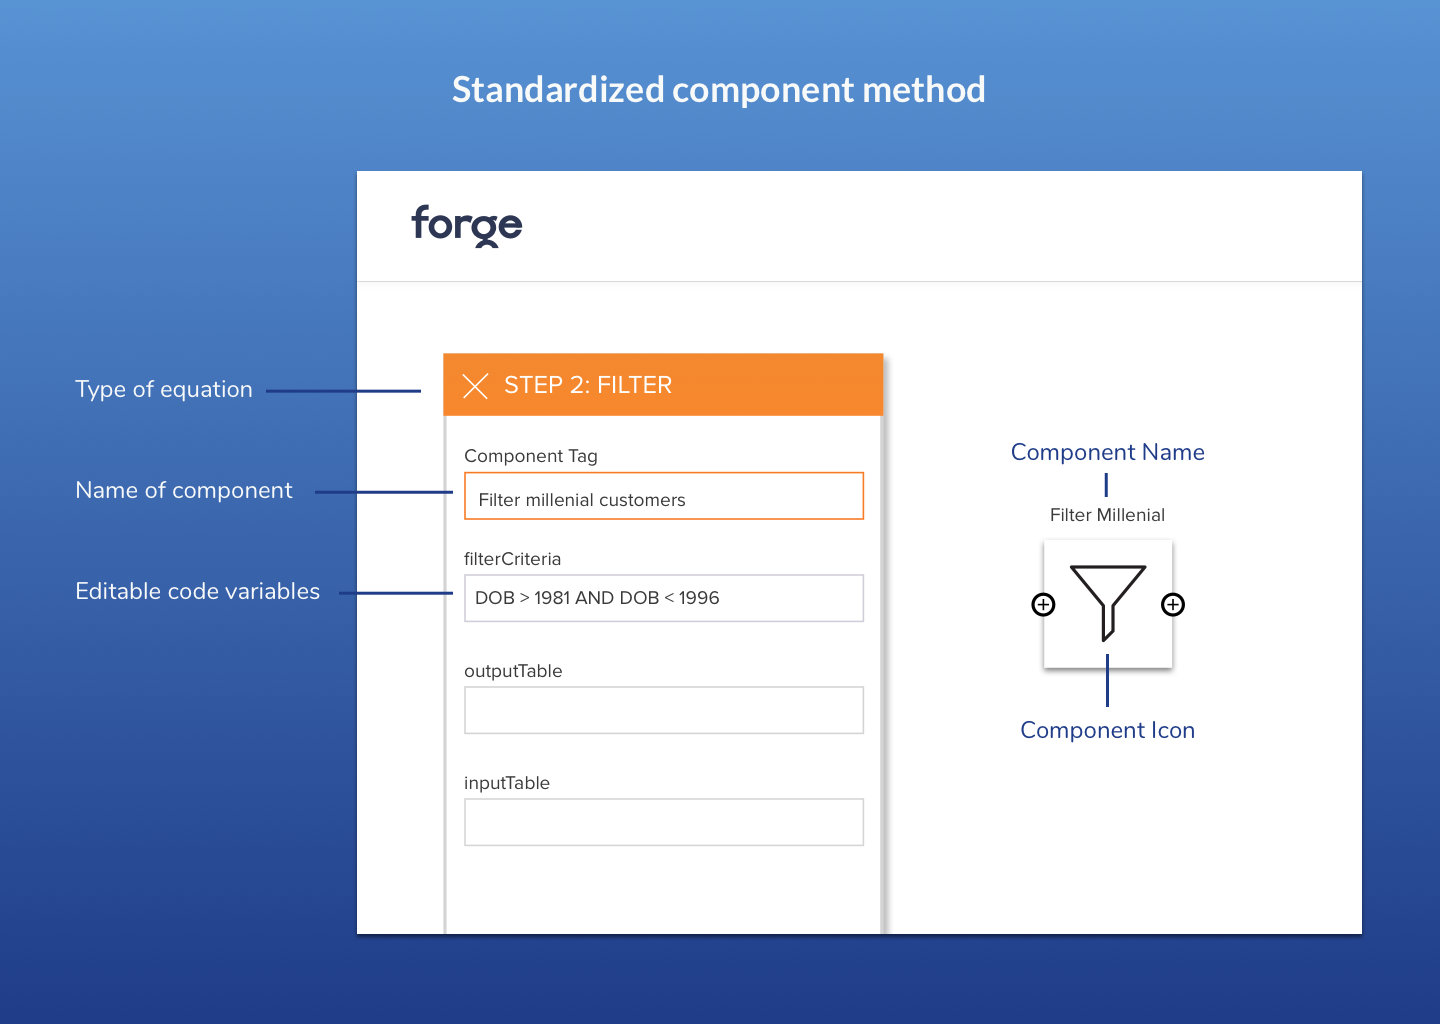
To make these components recognizable, I made sure to test with users the appropriate names and iconography of each component. This way if an analyst wants to segment out a millennial population, they can simply pick out the component for that formula instead of having to reinvent the wheel.
In the future I had planned to tie specific analysts for each component so they knew who to ask when help was needed.
Problem 2: Analysts are slowed down because they have to run their full system every time
One of the most shocking findings was that analysts would sometimes wait hours when testing just small parts of their code. This was because in order to run a job, they had to test their entire process instead of just one element.
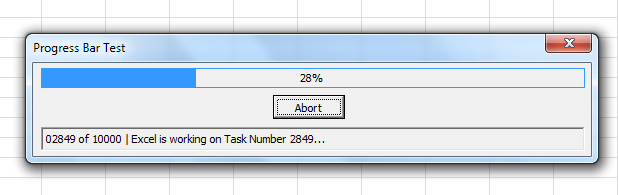
Sticking to our pizza analogy, let’s say you have mastered every part of making a pizza but you make horrible sauce. You would not want to keep making whole pizzas over and over again until you got it right. No, you would want to just focus on learning how to make the sauce first.
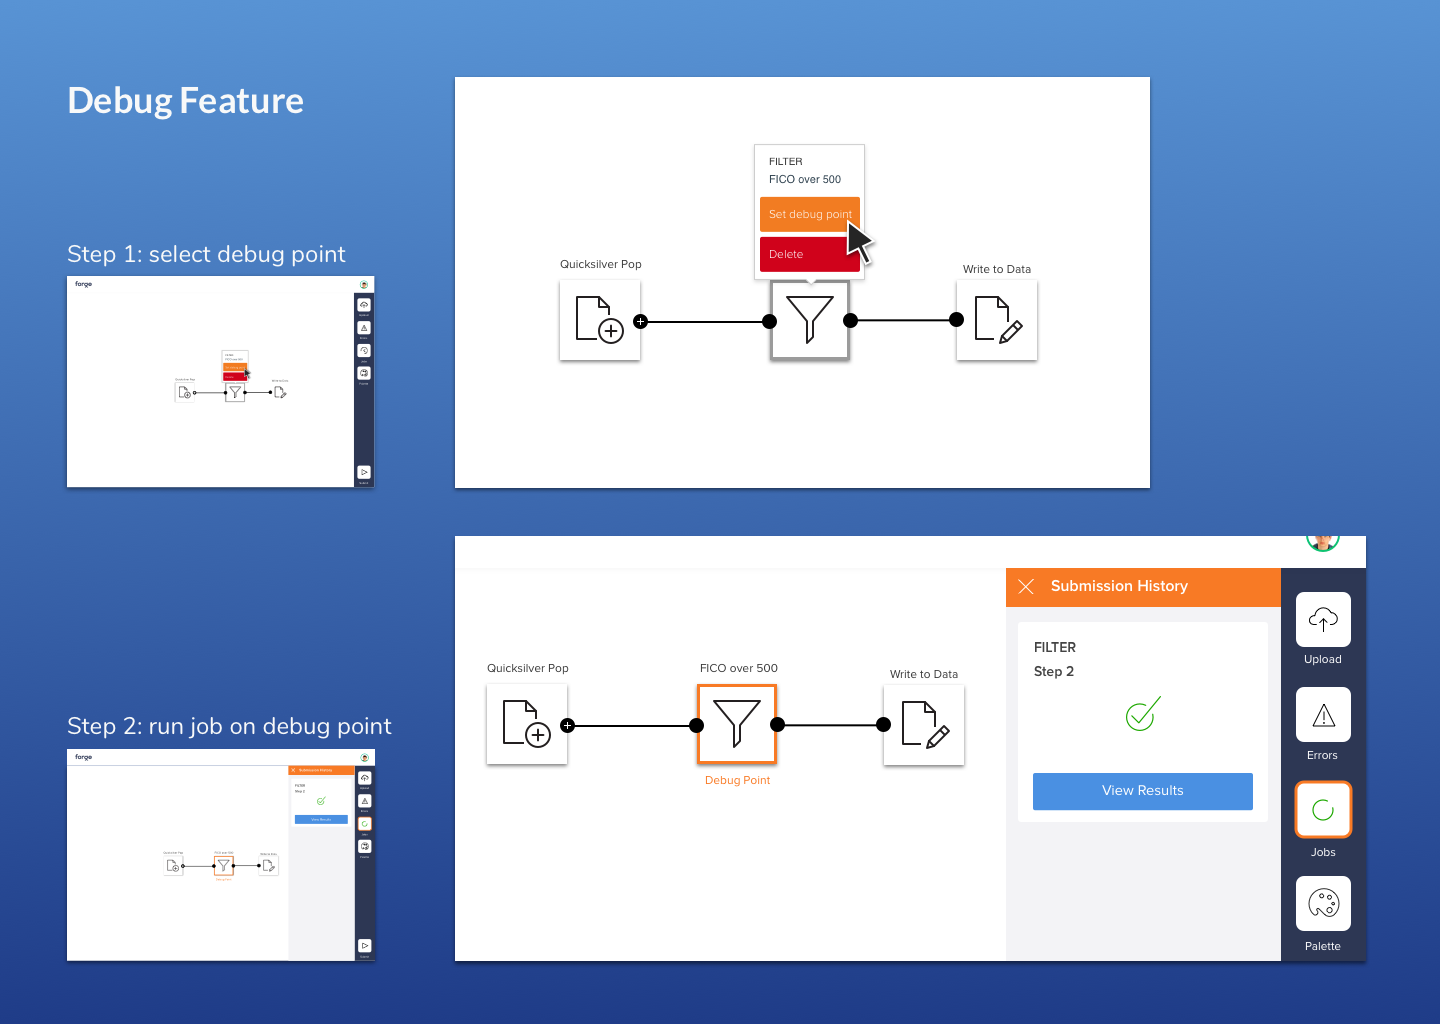
I worked closely with my developers to create a ‘debug’ point feature to address this problem. Analysts in our tool could pick a specific point in their process to run their job up to. This way they did not have to wait for their entire job to run and could focus on the specific portion they wanted to improve.
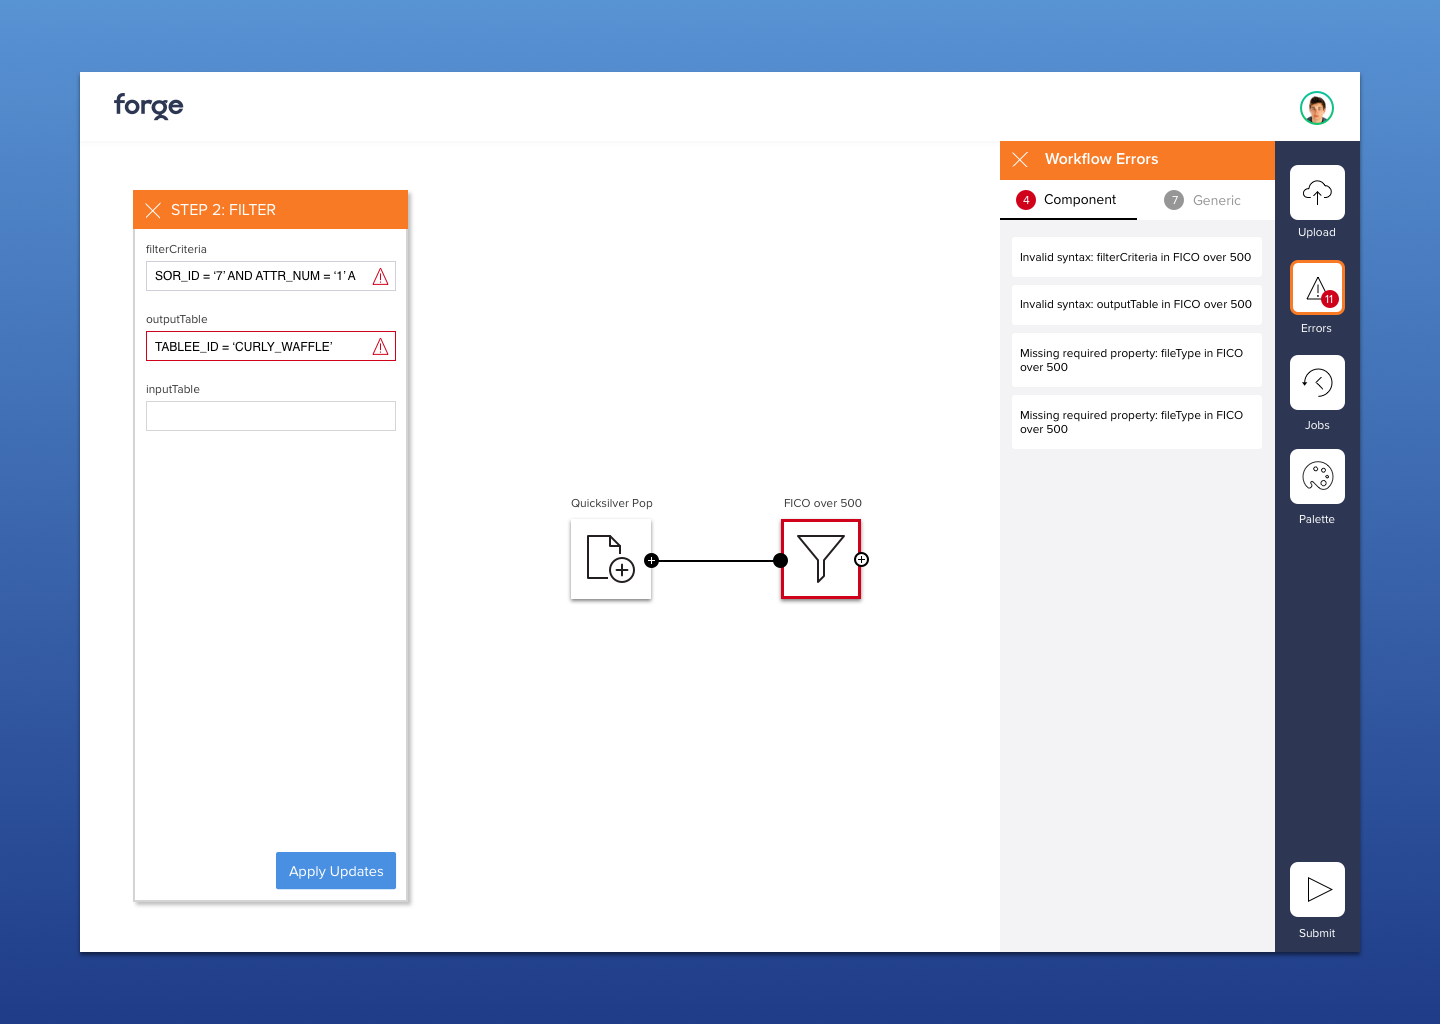
Problem 3: Errors are hard to locate and understand their cause
Hard to understand error messages would show up when analysts made mistakes in their code. Even when trying to find the specific cell that the error came from, analysts had difficulty navigating through a labyrinth of tables.
I made a point about this to my product manager and technical lead when they asked me to create the UI for errors. They revealed to me that there was in fact more metadata contained in an error that they could use to categorize an error and point to the specific field that the error originated from.
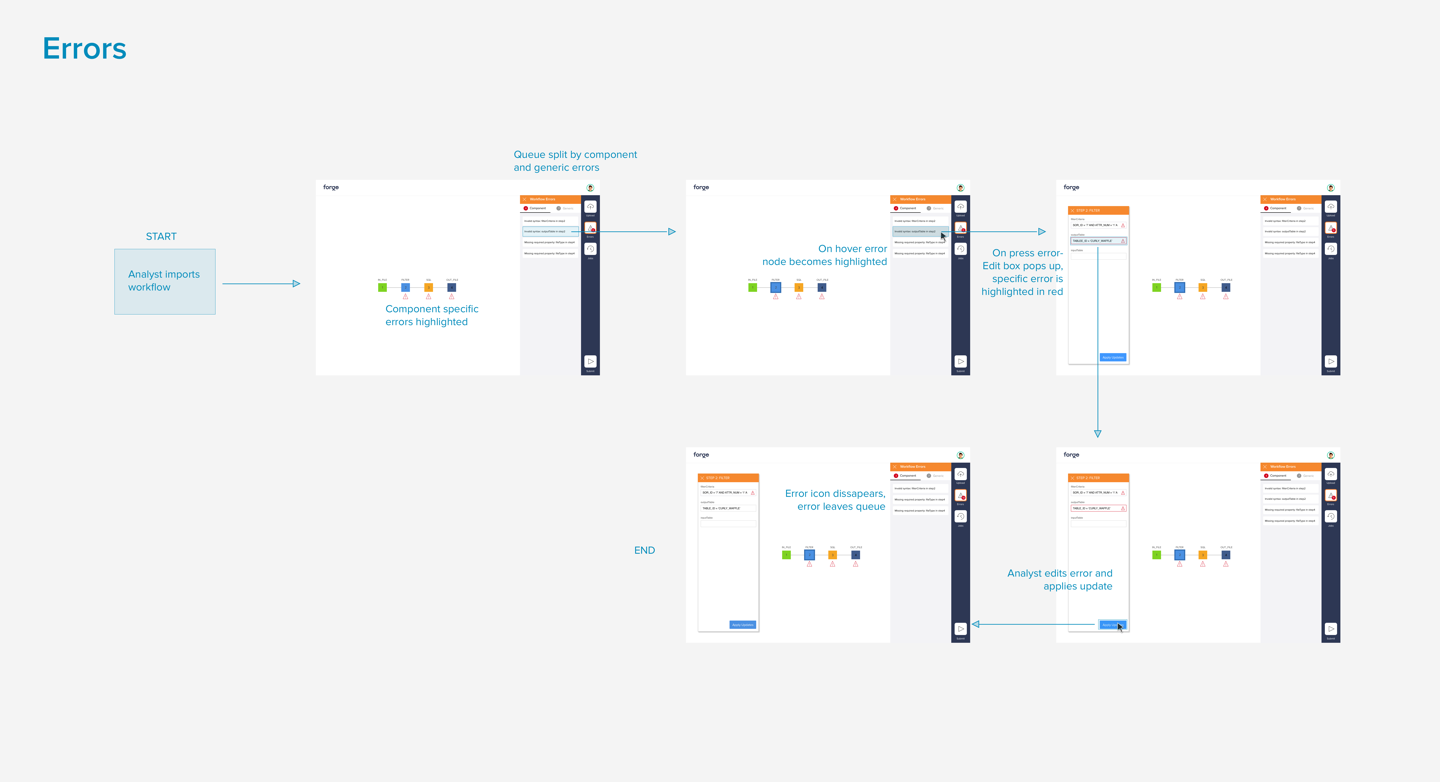
I designed an error feature that notified analysts of their “Generic” errors, which were system-wide, and “Component” errors that could locate the specific line where an error came from.
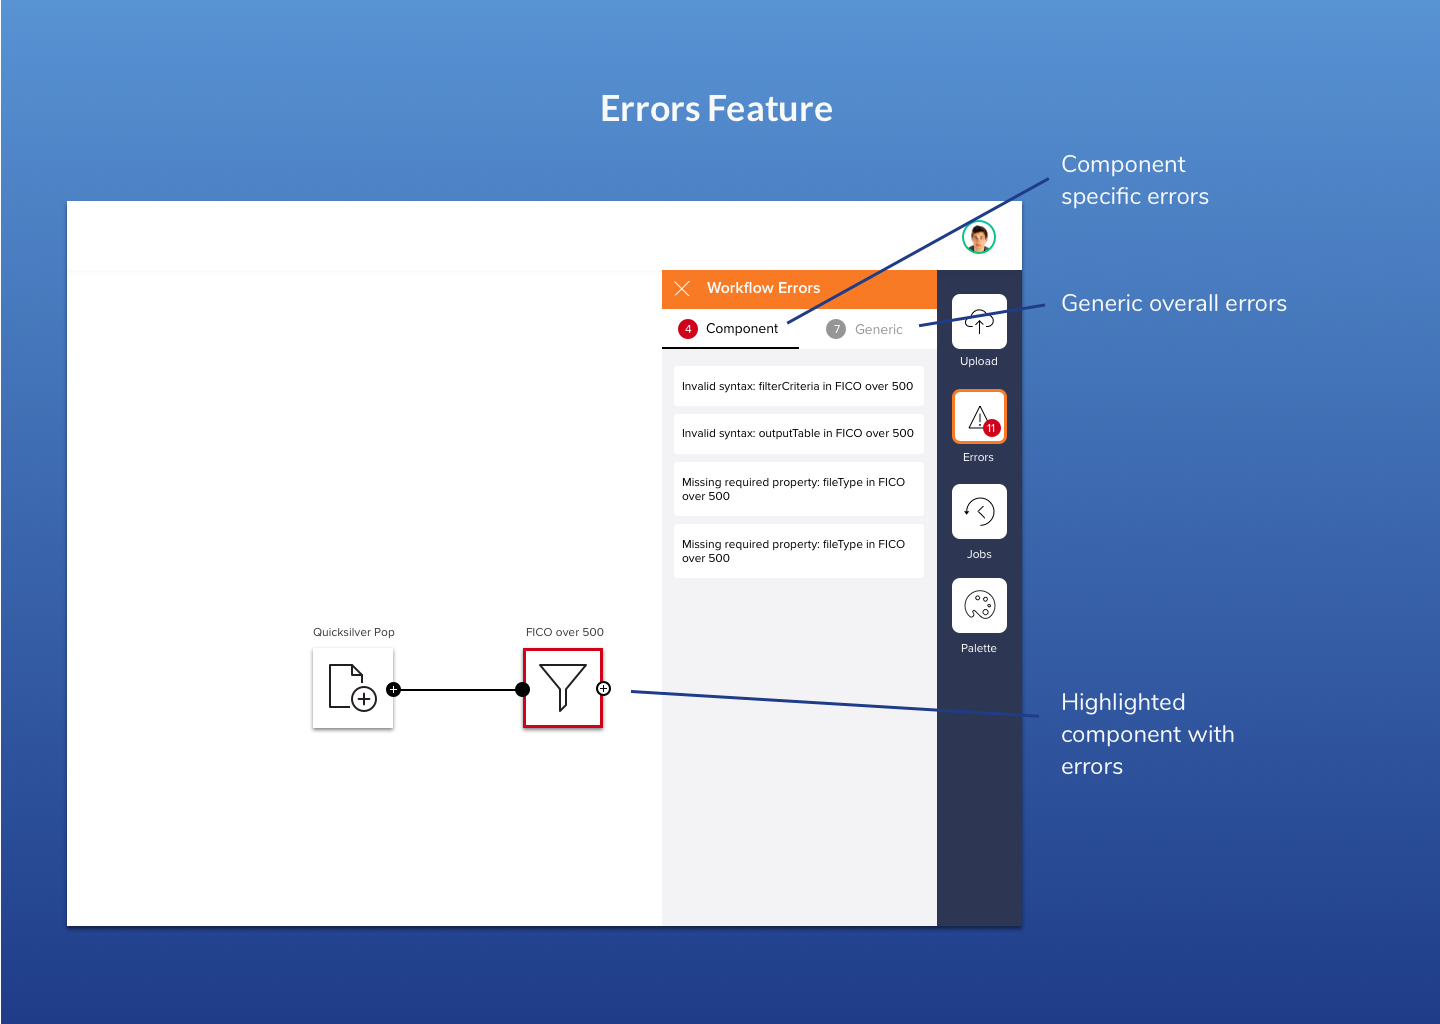
If a user selected a component error, an edit window pops that allows the analyst to edit their code on the spot.
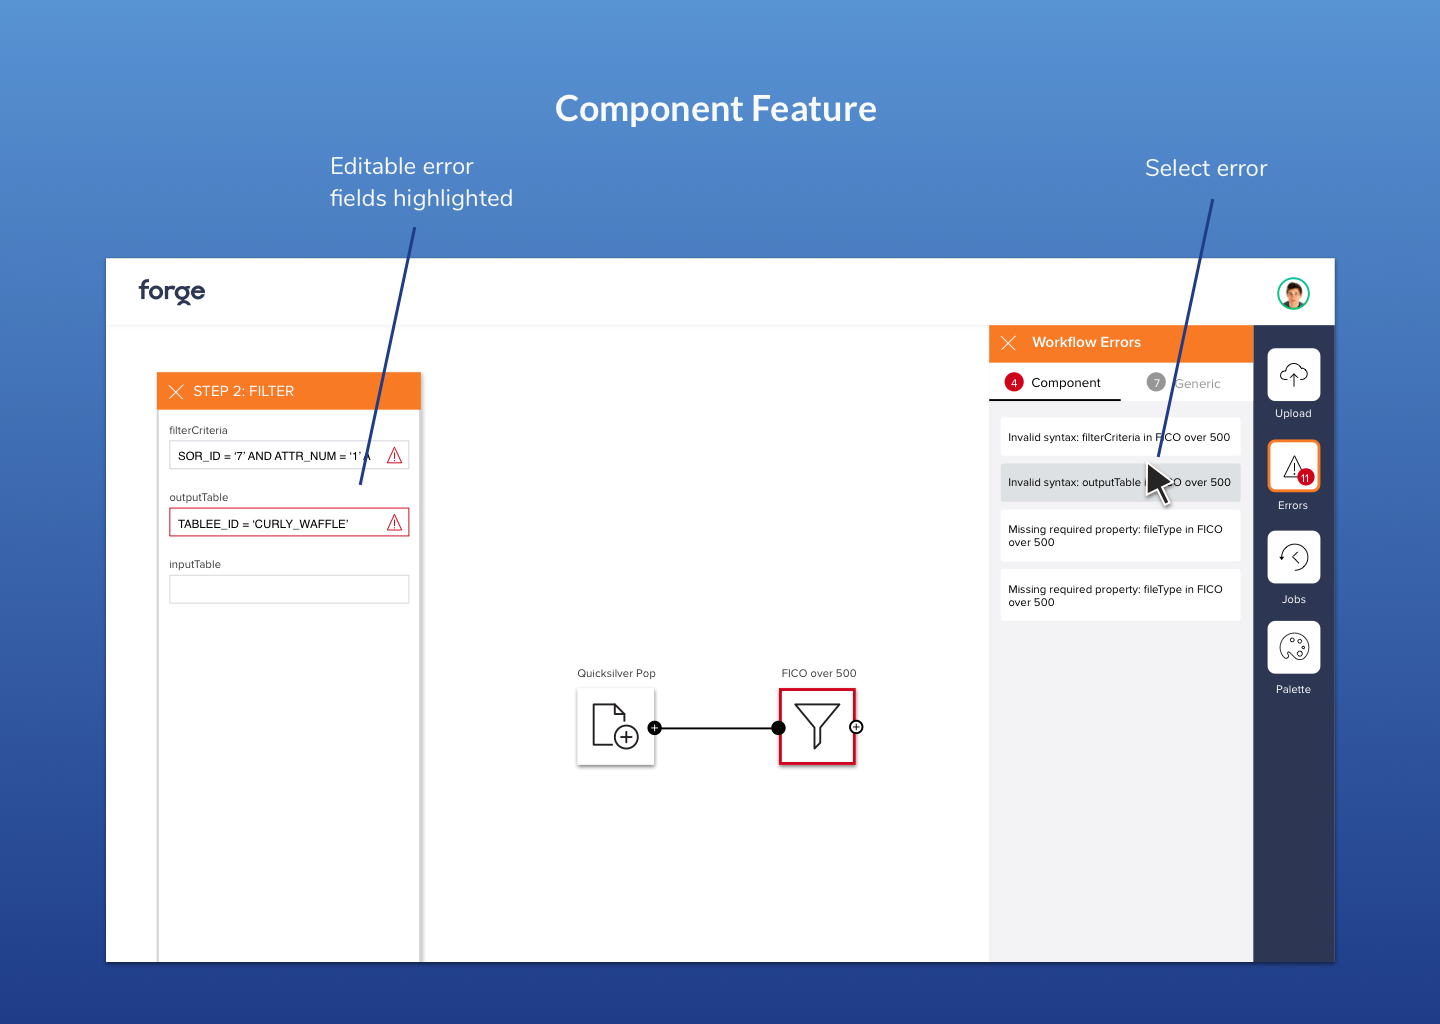
My product manager, who used to be an analyst himself, liked this feature as it allowed users to quickly get to the root of their errors.
Execution: flows, Zeplin and systems
One part of this project I am proud of is my execution process. I worked closely with my PM and tech partners on a different feature for each sprint. During the sprint I would create mockups and an InVision prototype to demonstrate a feature.
After mutually agreeing on the implementation, I would then use Zeplin to export screens, as well as give a flow diagram with more in-depth implementation directions from screen to screen.
After the first two sprints, I realized I was getting a lot of UI questions from my developers about when to use certain colors or how highlighting different elements would look like. I created a lightweight design system to make these conventions more clear – I realized that these were patterns that needed to be explicitly set and not something they could just pick up from one mock up screen showing the behavior.
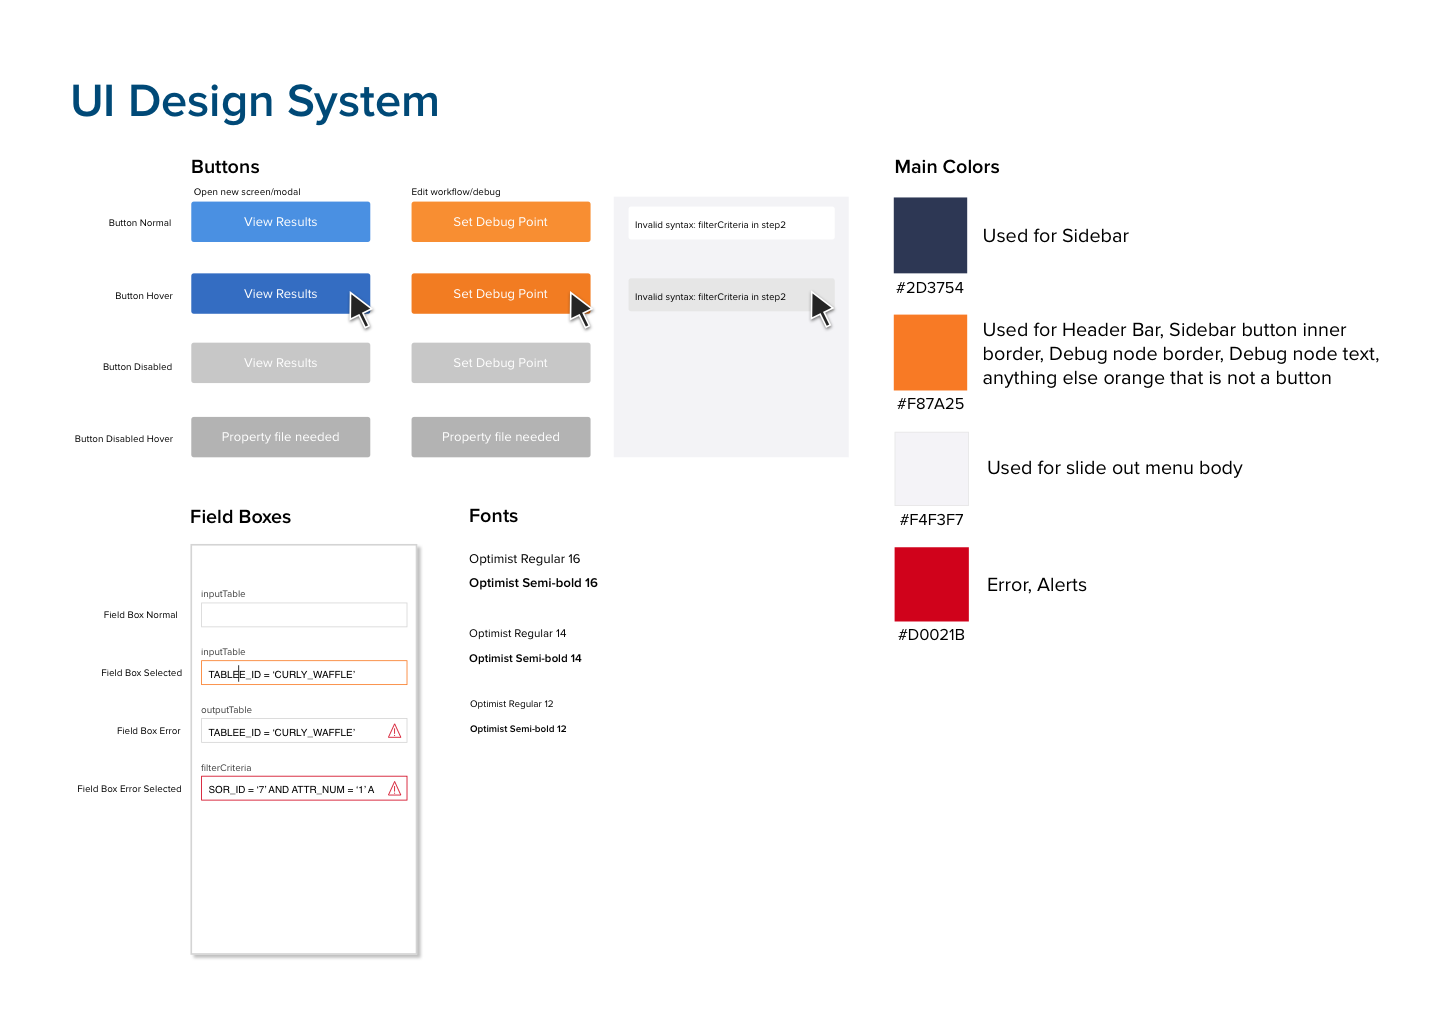
This design system helped streamline the front-end development process and made it easier when building out each new feature.
Conclusion
This project called on my design skills to lead and set the product vision for my team. After setting priorities for our MVP, our team build our product and released. We got great response from executives who decided to fund the project and push it further.